All the data presented is from year two growth in the field. It was organized in excel with 15 columns for every data point (Figure 3). The site name and line number are environmental and geographic variables while treatment and replicate numbers are manipulated predictor variables and summarize the treatments (seventeen treatments in total). The next seven columns (height, leader growth, root collar diameter, fireweed height, fireweed cover, aster height and aster cover) are all direct response variables while the final three columns (native herbaceous cover, non-native herbaceous cover and grass cover) are indirect response variables. Overall there are 357 experimental units (hitchhiker plants) per site.
No transformations were applied to the data; however any data point where either the spruce or forb died was discarded, as this study is focused on the interaction between the two species.
No transformations were applied to the data; however any data point where either the spruce or forb died was discarded, as this study is focused on the interaction between the two species.
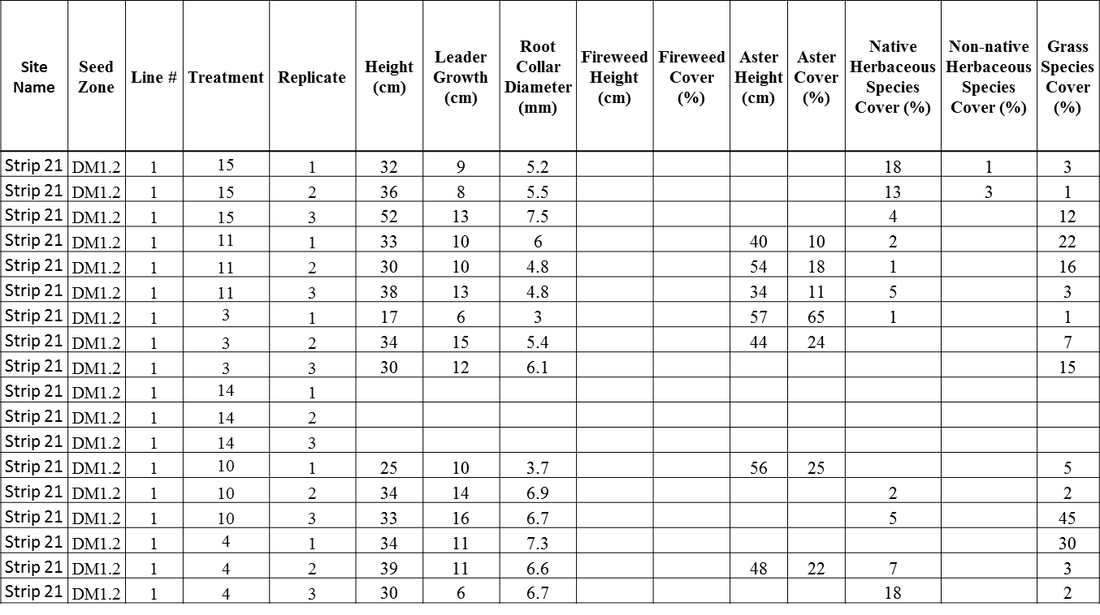
Figure 3. Subset of the data gathered for every hitchhiker plant.
Initial review of the data started with boxplots to look at distribution and outliers (Figure 4). The data generally followed a fairly normal distribution; however there was numerous outliers on the high end of the spruce height measurements. Initial review suggests this is due to significantly better growth on one section of one site. Those points were left in for this analysis since all treatments have the same effect including the control, however they may need to be removed in the future if they begin to introduce significant bias into the results. Boxplots were looked at for all variables with no other concerns noted.
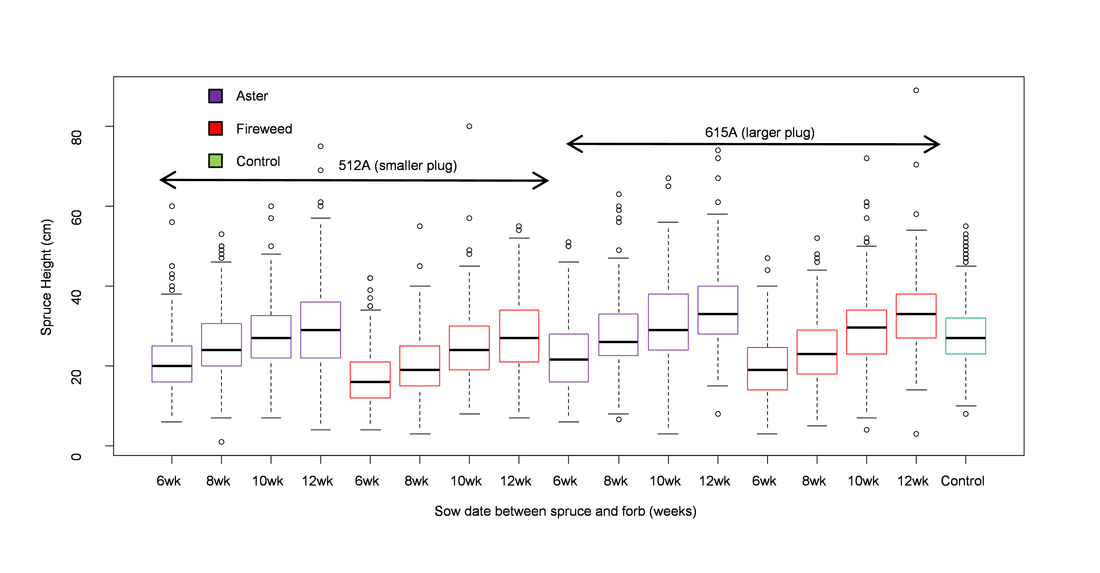
Figure 4. Boxplots of spruce height in centimeters by treatment.
When looking at a histogram of the residuals for spruce height the data followed a relatively normal distribution (Figure 5). There was no concerns noted that would limit the use of any statistical analysis. Histograms of the residuals were created for all variables with similar distributions.
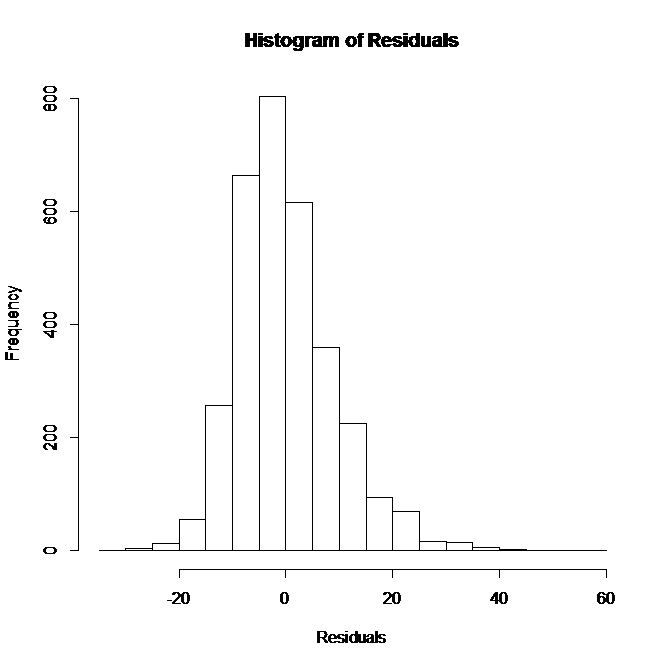
Figure 5. Histogram of the residuals for spruce height by treatment.
A residuals plot was created for spruce height by treatment (Figure 6) and there was no evidence that the data violated the assumptions of equal variance. Therefore there was no reason we had to limit ourselves in which statistical analysis to choose. Residual plots were created for all variables with similar results.
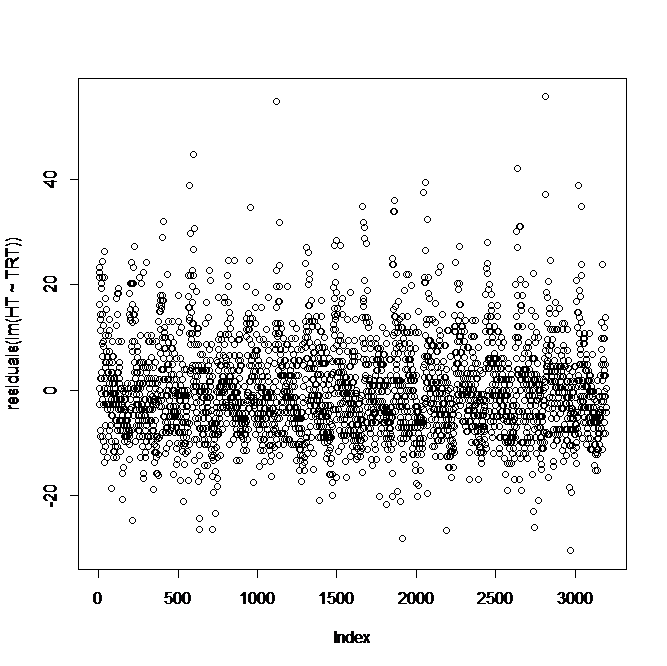
Figure 6. Residuals plot for spruce height by treatment.
